What do the candles mean on the stock chart on Webull?
Asked 5 years ago
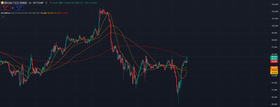
I'm learning how to read Webull charts. However, I don't really understand the colors or the timeframes on a candlestick chart. Any advice that can help me understand this?
Osasere Okunloye
Monday, October 04, 2021
Candlestick charts are used to determine the next action of the market based on past patterns. About the colour, If the body is painted black, it means the open price was higher than the close price. If it is empty, it means that the close price was higher than the open price.
Please follow our Community Guidelines
Related Articles

24Option Review: Account Types, CFDs, Safety, and More
Filip Dimkovski
December 23, 2024

Can You Use MetaTrader 4 With IQ Option?
Andrew Moran
December 22, 2024
Mastering Bitcoin Trading Strategies: A Comprehensive Guide
Ethan Collins
January 13, 2025
Related Posts
Blog
Filip Dimkovski
Is Webull Legit and a Safe Trading Platform to Use?
Answers
Filip Dimkovski
Is Webull a Safe Trading Platform?
Can't find what you're looking for?