How do I read a candlestick chart on Webull Trading Platform?
Asked 5 years ago
I can't make head nor tail out of these things. Why is it called a candlestick, what does it mean, and what am I supposed to be reading??? Help!
Osasere Okunloye
Tuesday, July 13, 2021
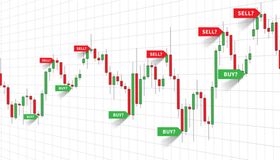
It is called candlestick charts because the bars look like candles. Candlestick charts help you read the emotions of the market representing the size price moves with different colours. The body represents the price range. A painted candlestick represents a lower close price, while an empty candlestick represents a higher close price. You can read more on how to make decisions using candlesticks.
Andia Rispah Igobwa
Friday, August 13, 2021
A candlestick chart is a common tool among technical traders. It shows the opening and closing price of the market for a particular time frame, as well as the high/low range (known as 'the body') each day.
Candlesticks use either a red or green bar to indicate higher prices than they were during the previous period. When using bars instead of lines, there will be one more candle called an 'inverse' or 'shadow' Candle Stick indicator, representing whether losses in this period would exceed gains in other periods (red) or vice versa (green).
To change your chart from bars to candlesticks on Webull's platform, go into Settings, where you can activate a wide range of settings related to time/date, indicators, and candlesticks.
In addition to the standard candlestick chart (top), Webull also presents the inverse/shadow candlestick chart (bottom).
You want to look for candles that are hollow or filled in with color to anticipate possible future price movements.
When a candle is hollow, it means that the closing price was below the opening price. When a candle is filled in with color, it means the closing price was higher than the opening price.
Please follow our Community Guidelines
Related Articles

The Best Trading Signal Providers on Trading Platforms and Social Media
Andrew Moran
December 22, 2024

Trading Forex With Binary Options in 2022: What You Need to Know
Brokereviews Staff
February 8, 2022

Guide to Day Trading Stocks for Beginners
Andrew Moran
February 27, 2022
Related Posts
Filip Dimkovski
Is Webull a Safe Trading Platform?
Filip Dimkovski
Is Webull Legit and a Safe Trading Platform to Use?
Can't find what you're looking for?
